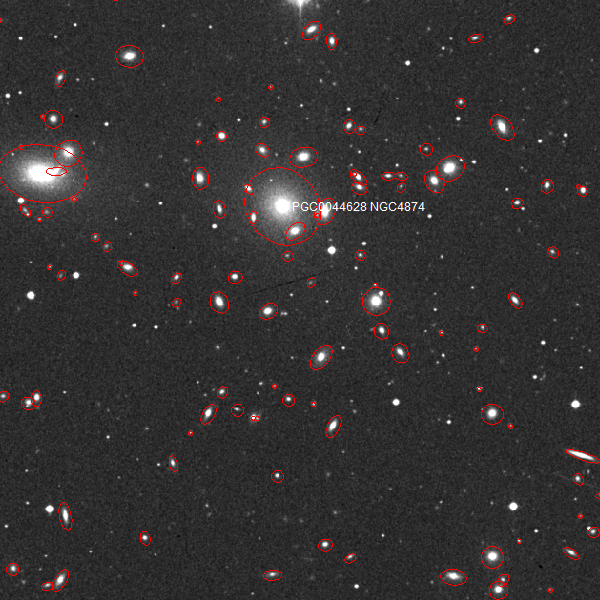
I have already posted one example of a cluster of morphologically similar galaxies arranged in a distinct spiral shaped pattern. These Abell clusters are typically grouped around a large elliptical galaxy and turned at an angle in relation to the observer. Abell 1656 exhibits this same super spiral structure in spite of the fact that many of the small compact galaxies in this cluster appear to be separated by great distances, according to their redshifts. The following image was exported from version 2.76c of Patrick Chevalley’s sky chart program Cartes Du Ciel. The photograph is from the European Southern Observatory’s (ESO) first Digitized Sky Survey (DSS-1) overlaid with object outlines generated from the Principal Galaxies Catalog (PGC).

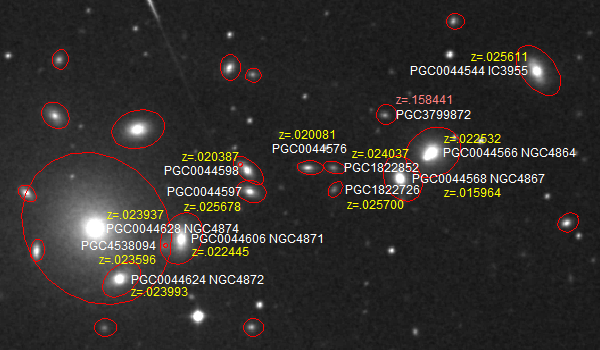
In the image are a large number of the aforementioned compact spiral galaxies extending outward from the elliptical galaxy NGC 4874 in three or more curved spiral arms. The image below, also exported from Cartes Du Ciel, is a close-up of one of these spiral arms. This photograph is from the ESO’s second Digitized Sky Survey (DSS-2) red channel while the object outlines are again generated from the PGC. In this image I have labeled in yellow the redshifts (z) for all the objects in the spiral arm including the center elliptical galaxy.

Most of these redshifts might seem to fall within a very narrow range of values. However when they are converted to distances it becomes obvious that the measurements vary significantly for such a tightly grouped set of objects. The smallest redshift value belongs to NGC 4867 at 0.015964 z. This places the galaxy at a supposed distance of over 282 million light years away when the redshift is converted to distance using a so-called Hubble Constant value of 55 (km/s)/Mpc. The highest redshift value belongs to PGC 1822726 which supposedly places it much further away at a distance of over 454 million light years using the same conversion method.
So here we have a group of small compact spiral galaxies packed so close together in a spiral arm configuration that a few of them appear to be almost touching; yet their redshifts indicate a maximum separation of over 171 million light years when viewed from Earth. There is also a galaxy in this spiral arm that appears to be the same size and shape as a couple of the other smaller galaxies in the arm but with a redshift of 0.158441 z. This value, which I’ve marked in red, supposedly places this galaxy at an incredible distance of over 2.7 billion light years away! This galaxy also shares the exact same morphology with several similarly sized galaxies in the other arms of the super spiral and yet is supposedly located almost ten times further away!
Once again scientists are faced with a big question: How can multiple objects be arranged in such tightly defined spiral shapes yet be separated from one another by such vast distances and only along one axis? And once again scientists can try to dismiss the findings as coincidence or dismiss the question altogether. But the evidence that extragalactic redshifts do not accurately represent distances and an associated expansion of the Universe will still continue to mount. I will of course continue to post examples of super spiral groups in this Report and I will continue to draw attention to the evidence. Questions and comments about any of these examples or the evidence are welcomed as always.
Shannon
Tags: Abell 1656, Cartes Du Ciel, Digitized Sky Survey, European Southern Observatory, galactic cluster, George Abell, Principal Galaxies Catalog, Super Spiral

Abell 1656 is, I think, the famous Coma cluster.
Redshifts of galaxies in rich clusters like this one exhibit the “Fingers of God” effect; in mainstream astrophysics this is explained as the distribution of ‘peculiar velocities’ (or redshifts) due to the motion of galaxies in such rich clusters, relative to the cluster’s center of mass. In the case of the Coma cluster, these peculiar velocities are – as I understand it – consistent with a more-or-less spherically distributed mass, centered on the center of the cluster. Somewhat like the line-of-sight velocities of stars in a rich globular cluster.
The standard interpretation of the higher (and lower) redshift galaxies in the Coma cluster field is that they are background (foreground) objects, physically unrelated to this cluster. As I understand it, because there is no evidence of “interaction between the objects via bridges of material or disturbances such as the entrainment of material”, these higher (and lower) z objects could, in fact, be chance alignments (by your own methodology, Shannon).
As to “morphologically similar galaxies arranged in a distinct spiral shaped pattern”, I must say that I myself cannot see any such spiral pattern. Would it be possible for you to produce some illustration/graphic showing this pattern?
You are correct, Abell 1656 is best known as the Coma Cluster. But it is much larger than the section I examine on this page, so I decided to stick with Dr. Arp’s identifier to try to avoid some confusion and having to name the object NGC 4874. However I think I may need to modify my post to further clarify what exactly is being shown.
Admittedly this galaxy cluster does not exhibit a spiral pattern quite as distinct as the one in Abell 193. However I do see what could be three separate arms, one of which I have shown in detail on this page. This particular arm turns out from a central axis beginning roughly at the twelve o’clock position and ending roughly at the two o’clock position. Of the other two arms, one turns out sharply to the right from roughly the four o’clock position and ends at roughly the seven o’clock position. The other arm turns sharply right from the six o’clock to nine o’clock positions from the same central axis located just south-west of NGC 4874. I hope this description makes some sense. In the meantime I will try to think of a way to best display the spiral pattern in this example without unduly influencing the viewer.
But the spiral pattern and its position within the Coma Cluster is just one facet of this example. I think it is important to note that in my close-up view of one of the many chains of galaxies within the cluster there are galaxies that share the same morphology, size and brightness. Yet they are supposedly separated by hundreds of millions and even billions of light years from our point of observation according to their redshifts.
In the case of nearby, rich clusters like the Coma cluster, I think a para or two on the context/environment would be very helpful to the general reader.
In one part of the Galaxy Zoo (Hubble Zoo? also the CANDELS images?) we zooites were offered the choice of classifying the pattern of clumps – in ‘mostly clumpy’ objects – as ‘chain’, ‘spiral’, and so on. I could rarely see any spiral pattern, so maybe I’m just not sensitive to such patterns. So it would be very good if you could somehow show the spiral shape you can see.
“… one of the many chains of galaxies within the cluster there are galaxies that share the same morphology, size and brightness” This sort of thing seems very common in rich clusters; here is a particularly striking example (there are many more in the GZ forum thread Clusters of Galaxies http://www.galaxyzooforum.org/index.php?topic=73.0 ):
http://casjobs.sdss.org/ImgCutoutDR7/getjpeg.aspx?ra=213.77837943&dec=-0.4922033&scale=0.39612&opt=&width=512&height=512
“Yet they are supposedly separated by hundreds of millions and even billions of light years from our point of observation according to their redshifts.” Could you clarify one thing for me please? Velocity dispersions of >1,000 km/s are quite common in rich clusters, and the blind application of the Hubble redshift-distance relationship will produce just this kind of apparent, but unreal, distance separation. Perhaps a good galaxy to illustrate this is M90, a prominent spiral galaxy which is a member of the Virgo cluster (e.g. Wikipedia: http://en.wikipedia.org/wiki/Messier_90 ). It has a negative redshift, so applying the Hubble relationship to it gives a nonsense result. How do consider this?
If an object is traveling towards us at sufficient enough speed the Doppler Effect will blue-shift its spectrum strongly enough to negate and even exceed whatever intrinsic redshift value the object may possess. Velocity dispersion may be common in rich clusters but the difference in redshift values I marked in Abell 1656 are .009736 z not counting the very high redshift value for IC 3955. This equates to a velocity of almost 3000 km/s, a speed far exceeding any dispersion rate I have ever seen published.
“Velocity dispersion” refers to the estimated σ of the observed (LOS) velocity distribution; roughly, if you have ~1,000 galaxies, and a velocity dispersion of 1,000 km/s, you would expect ~one pair to have a velocity difference of ~3,000 km/s. This, of course, assumes the distribution is Gaussian (or close to it); in the case of the Coma cluster, that has been known to be a poor assumption for some time now (e.g. Colless & Dunn, 1996 (Astrophysical Journal v.458, p.435)) … it is better modeled as two distinct sub-clusters. In a field as large as this, foreground and/or background (chance alignment) galaxies are to be expected, aren’t they?
To expect one pair of galaxies out of a 1,000 to have a velocity difference of 3,000 km/s is a statistical stretch at best. How do you explain a cluster that has a dozen or more objects with this difference? Of course chance alignments of galaxies occur, but that does not explain how these galaxies form long chains or spiral arms.